Govindraj Shetty
Customer Support & Success Leader · SaaS · CX Strategy
With over 19 years of experience in customer support and success across global organizations, Govindraj Shetty has built a career grounded in operational excellence and customer-centric leadership — transforming support teams into structured, revenue-aligned functions.
He began his journey at Stream Global Services (now Concentrix), where he rose from Customer Support Agent to Call Center Team Manager over 7 years.
At Yapsody, Govindraj built the Customer Support department from the ground up — designing systems, SLAs, tools, and performance frameworks — and later established the Customer Success & WebSales department to drive retention and growth.
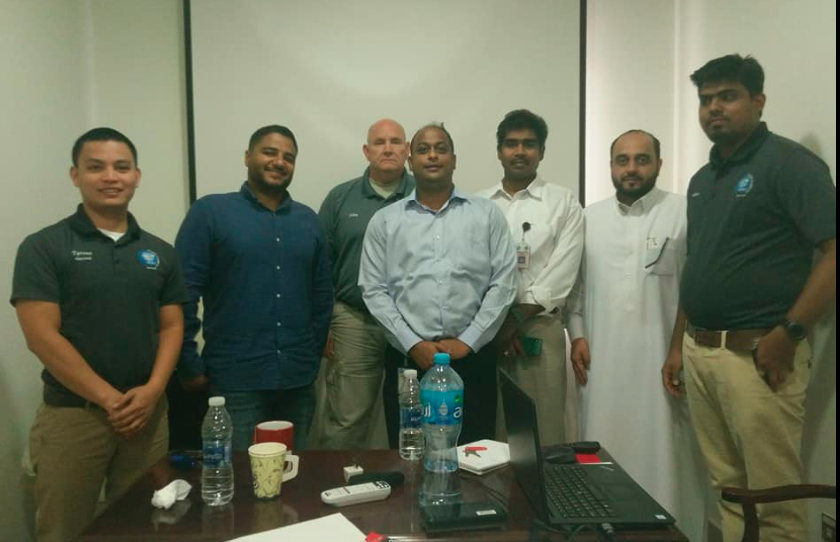
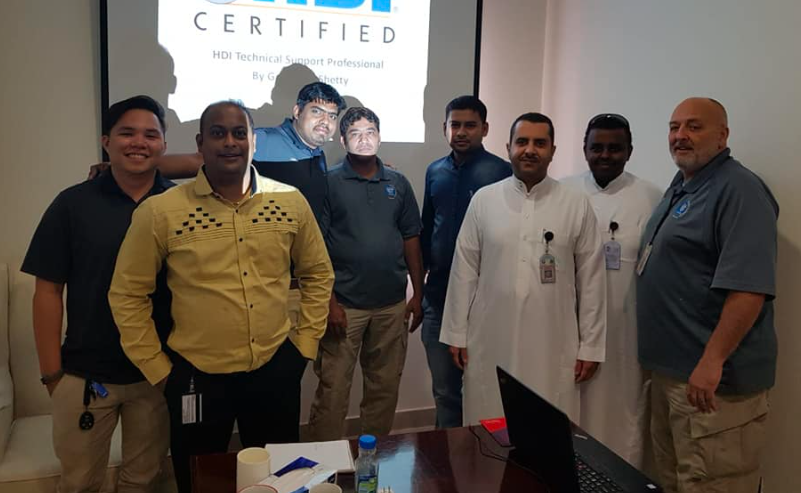
He has conducted onsite training in Dubai and Saudi Arabia and trained over 1,000 IT professionals at Cognizant including Service Delivery Managers.
As a Udemy instructor, he has trained 3,000+ students globally with a 4.5-star rating. His Customer Support Team Leader Mastery Program has achieved Best Seller status.
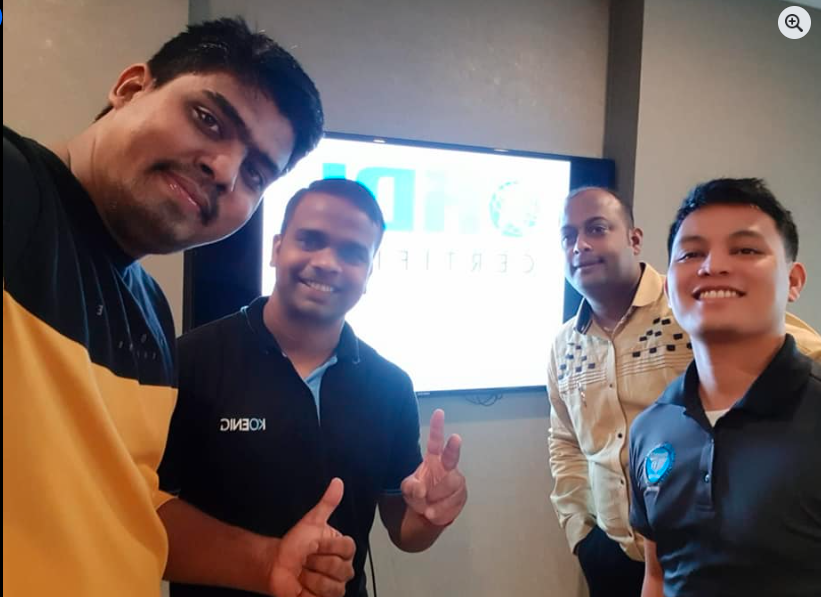
He is also the founder of The Customer Support School and a published author on Amazon, writing books focused on building high-performance support organizations. Also HDI Certified Support Center Manager & Trainer.
Brands We've Trained & Worked With
Trusted by global organisations and teams across industries


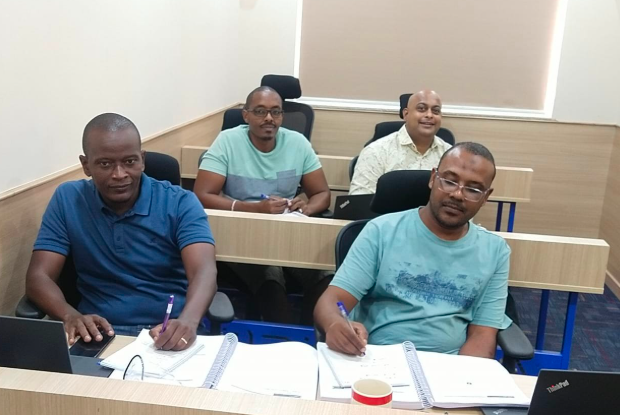
Onsite Training Delivered Across Regions
From the Middle East to India, TCSS has delivered onsite training programs tailored to real operational needs — enabling teams to improve performance, leadership, and customer outcomes.